 AlgoVistra
Live candles, not screenshots
The assistant knows the pair, timeframe and visible range of your chart and reads exact prices, so nothing is estimated from an image.
AI chart analysis
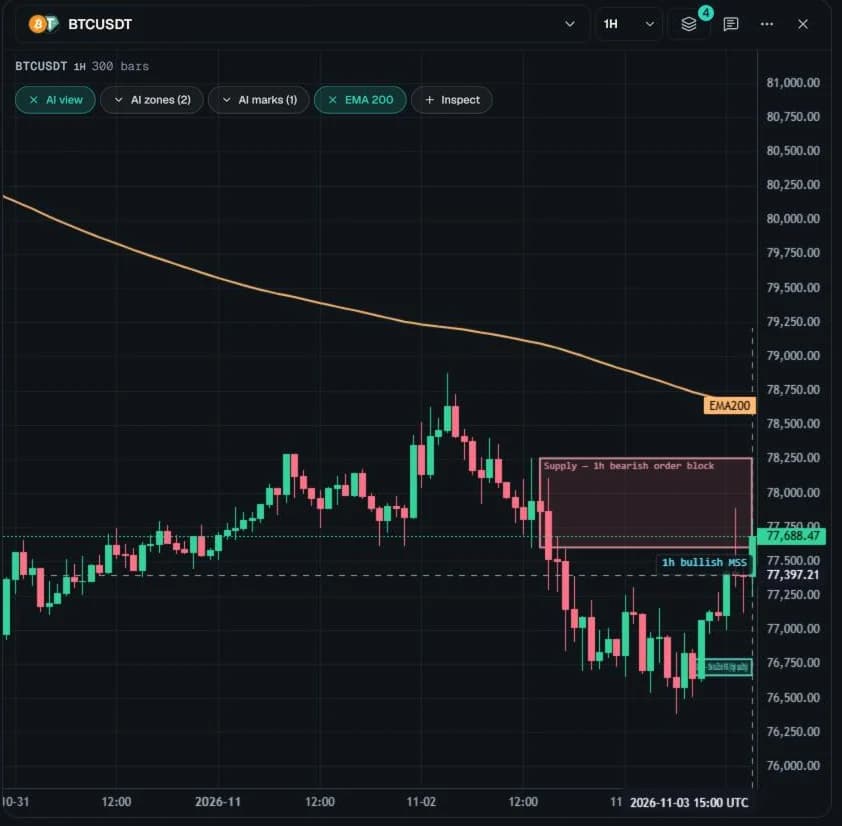
Open a chart and ask. AlgoVistra reads the live candles for that pair and timeframe, explains structure, key zones and liquidity in plain words, and draws what it found on the same chart. No screenshot to crop or upload.
What is AI chart analysis?
See it on the chart
The answer explains what the candles show and where the read would be wrong. The analysis layer opens on the product's own chart, with every level inspectable.
Illustrative conversation · Sample data · Not financial advice
AI technical analysis
The assistant knows the pair, timeframe and visible range of your chart and reads exact prices, so nothing is estimated from an image.
Higher highs and lows, break of structure and change of character, explained with the candles that prove them.
Support and resistance, order blocks, fair value gaps, liquidity pools and volume profile levels, each with a reason.
One AI layer of levels, zones and marks. Inspect each item, hide it, or clear it; your own drawings stay as they are.
Check whether the daily, 4H and 1H agree with the chart you trade. For news and macro context, see AI market analysis.
Every read says what would invalidate it, so you get a picture to test, never a signal to follow.
How it works
Pick a supported forex pair, gold, crypto or index and a timeframe in the chart panel next to the chat.
Ask for the structure, key zones, liquidity, or what would change the picture. Plain words are fine.
Read the explanation, show the analysis layer, and inspect each level against the candles before you decide anything.
Screenshot AI vs live data
Screenshot chart analyzers are quick, but an image hides the numbers. Reading the data behind the chart changes what the AI can tell you.
| Feature | AlgoVistra (live data) | Screenshot AI analyzer | General AI chatbot |
|---|---|---|---|
| What it reads | The candles behind your open chart | Pixels in an uploaded image | Only what you type or paste |
| Price levels | Exact prices from the data | Estimated from the axis | None without data |
| Other timeframes | Five, read automatically | One screenshot per timeframe | No |
| Drawn back on the chart | An AI layer you can inspect or clear | Annotated copy of the image | No |
| Knows your rules and trades | Profile and journal checked first | No | Only within one chat |
| News and economic calendar | Included in the read | Usually not | If it can browse |
FAQ
When you chat with a chart open, AlgoVistra sends the pair, timeframe and visible range with your message. The assistant reads the candle data and detected levels directly, which is more exact than reading prices off an image.
Yes. AlgoVistra's Free plan includes AI chart analysis with a daily limit of AI replies, no card and no time limit. Paid plans add more AI usage and higher chat tiers.
Supported forex pairs, gold, crypto and indices. If a market you trade is missing, you can request it from the chart panel.
Yes, when you ask. The analysis appears as one layer of levels, zones and marks that you can inspect, hide or clear, and it never changes your own drawings.
Market structure (break of structure, change of character), support and resistance, order blocks, fair value gaps, liquidity, volume profile, Fibonacci, price-action patterns and indicators such as RSI, MACD, ATR and ADX.
No. It explains structure, levels and scenarios, including where a view would be wrong, so you can make your own decision. AlgoVistra never places trades, and its analysis is not financial advice.
Start free
Open a live chart, ask your first question and see the analysis drawn where it belongs. Free, no card.
Free plan with no time limit. No card needed.